Clorox’s FY18 Report Reveals What Truly Defines a Brand


By Benno Dorer, Clorox chairman and CEO
What makes Clorox succeed where other companies don’t? We believe it’s our diverse portfolio of leading brands.
It’s what allows us to constantly reinvent ourselves over more than 105 years — through product innovation, operational innovation and the use of technology.
And through our diverse portfolio of brands, we’re asserting our leadership — investing in our people and embracing corporate responsibility priorities.
When we do these things, we deliver the superior value our consumers around the world have come to expect.
How do we measure that? With data like this:
- 80 percent of consumers say our brands are equal to or superior to the competition.
- Our brands can be found in nine of 10 U.S. households — a million more than last year.
We explore “What’s in a brand?” and share the year’s achievements in our 2018 integrated annual report, which was just released this week.
Here are some highlights:
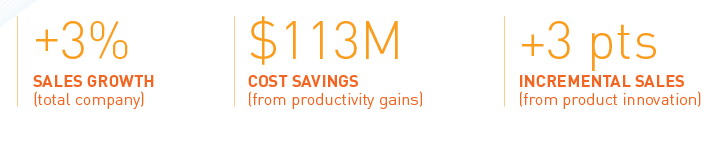
- 3 percent sales growth on top of 4 percent a year ago.
- 3 points of incremental sales from product innovation for an eighth consecutive year.
- 88 percent employee engagement, matching last year’s all-time high.
- A 15-point increase in the percentage of our product portfolio with sustainability improvements, landing just short of the company’s 50 percent goal three years ahead of schedule.
The following are highlights of workforce diversity progress and community impact from fiscal year 2013 to fiscal year 2018:
- A 4 percent increase in U.S. minority nonproduction managers, now at 28 percent.
- A 13 percent increase in female executive committee members, now at 33 percent.
- More than $25 million in foundation and corporate cash grants.
- More than $44 million in product donations.
- More than $6 million toward cause marketing campaigns.
- Close to 645,000 employee volunteer hours, effort valued at approximately $16 million.
The following are highlights of sustainability progress as of the end of the 2017 calendar year, compared to the 2011 calendar year baseline:
- 49 percent of the product portfolio with sustainability improvements. The 50 percent goal is expected to be met by the end of the 2018 calendar year.
- A 17 percent reduction in energy use, per case of product sold. The 20 percent goal is on track to be met by the end of the 2020 goal period.
- A 32 percent[1] reduction in greenhouse gas emissions, 22 percent reduction in water use and 33 percent reduction in solid-waste-to-landfill, per case of product sold. The 20 percent reduction goal in all of these operational footprint areas was met ahead of schedule.
- Eight zero-waste-to-landfill sites, up from three in calendar year 2016. The goal of 10 zero-waste-to-landfill sites is on track to be completed before the end of the 2020 goal period.
For the seventh year, the Clorox annual report presents a consolidated view of our company’s financial, environmental, social and governance performance. We’re proud to be one of only 24 organizations in the U.S. — and the only company in the consumer packaged goods sector — that practices integrated reporting, which has been adopted in 62 countries, including all G-20 industrial and emerging market countries as well as BRICS economies, according to the Corporate Register, an online directory of corporate responsibility reporting.
How can you view the report? There are multiple ways:
Full report. This 75-page document, available as an online PDF only, contains detailed progress against our business and corporate responsibility priorities, both for the year and longer-term goal period. It includes information on our strategy and the GRI Content Index as well. It can be found on TheCloroxCompany.com > Investors or downloaded from the annual report microsite at http://annualreport.thecloroxcompany.com under Resources.
Executive summary: This 16-page+ document, available as an online PDF (in English and Spanish) and printed booklet, incorporates highlights from the full report. Like the full report, it can also be found on TheCloroxCompany.com > Investors or downloaded from the annual report microsite at http://annualreport.thecloroxcompany.com under Resources.
Microsite: A website dedicated to the annual report is accessible at annualreport.thecloroxcompany.com. It includes animated content, video, and downloadable versions of the printed executive summary and full online report.
[1] Percentage reflects a change in methodology for calculating Scope 3 emissions because the U.S. EPA stopped supporting the methodology previously used by Clorox. The methodology change was applied to the CY11 baseline to enable comparisons, but GHG emissions for 2012 to 2016 were not restated.